Fruit and Vegetable Serving Calculator
Plan produce by people, days, daily cup-equivalent goals, fruit and vegetable mix, raw-to-edible yield, cooked or raw serving style, leftovers, and waste factor.
🫑Produce planning presets
Choose a grocery, meal prep, family, party, or snack-box starting point, then fine tune the serving goals and produce mix.
📝Serving inputs
Produce Serving Plan
Results use cup-equivalents first, then translate those servings into edible cups, raw purchase volume, approximate weight, cooked volume, and waste-adjusted shopping amounts.
Detailed breakdown
🧺Quick produce totals
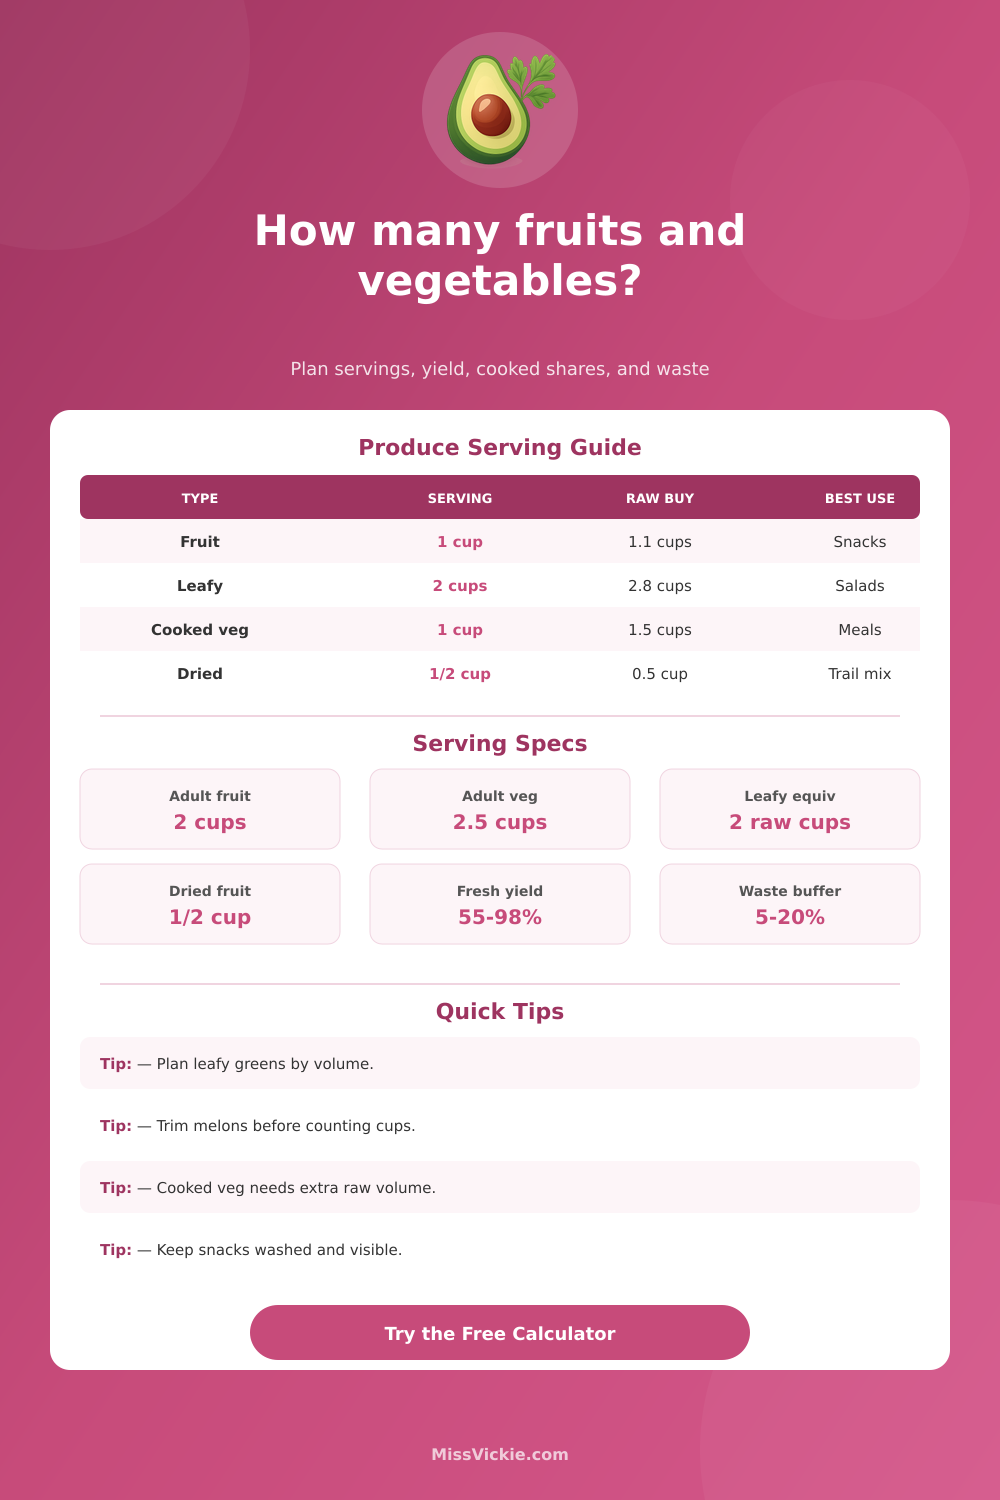
📏USDA-style serving size guide
| Produce item | Cup-equivalent serving | Typical edible weight | Planning note |
|---|---|---|---|
| Fresh, frozen, or canned fruit | 1 cup pieces or slices | About 5 to 6 oz / 140 to 170 g | Use drained cups for canned fruit and trimmed cups for whole fruit. |
| Dried fruit | 1/2 cup dried fruit | About 2.5 to 3.5 oz / 70 to 100 g | Dried fruit is dense, so it uses less volume for the same fruit credit. |
| Raw or cooked vegetables | 1 cup raw or cooked pieces | About 3.5 to 5.5 oz / 100 to 155 g | Dense chopped vegetables weigh more per cup than leafy greens. |
| Leafy greens | 2 cups raw leaves | About 2 to 3 oz / 55 to 85 g | Raw leafy greens usually count as half credit by volume. |
| Beans, peas, and lentils | 1 cup cooked | About 6 to 7 oz / 170 to 200 g | They can count as vegetables in many meal plans. |
| 100 percent juice | 1 cup juice | 8 fl oz / 240 ml | Use juice sparingly when the goal is whole produce volume. |
⚖Raw-to-edible yield table
| Produce category | Usable yield | Buy for 10 edible cups | What changes the yield |
|---|---|---|---|
| Berries and grapes | 90% to 98% | 10.5 to 11.1 raw cups | Sorting stems, moldy berries, and grape clusters. |
| Apples and pears | 84% to 92% | 10.9 to 11.9 raw cups | Cores, bruising, peel preference, and slicing loss. |
| Citrus fruit | 68% to 78% | 12.8 to 14.7 raw cups | Peel thickness, membranes, seeds, and pith removal. |
| Melon and pineapple | 48% to 62% | 16.1 to 20.8 raw cups | Rind, core, seed cavity, and uneven trimming. |
| Leafy greens and herbs | 60% to 75% | 13.3 to 16.7 raw cups | Stems, wilted leaves, washing, and drying loss. |
| Root vegetables | 82% to 92% | 10.9 to 12.2 raw cups | Peeling, tops, root tips, and bruised spots. |
Nutrition-style serving goals count edible cup-equivalents, but grocery lists start with raw whole produce that still has peels, cores, stems, or rind.
Frozen or pre-cut produce has a higher usable yield, but cooked volume can still shrink after roasting, sauteing, steaming, or draining.
🔥Cooked and raw serving conversion grid
| Serving style | Counts as | Raw volume to prep | Weight shortcut | Best examples |
|---|---|---|---|---|
| Raw fruit snack cups | 1 fruit cup each | 1.05 to 1.25 raw cups | 5 to 6 oz edible per cup | Apples, berries, grapes, citrus, melon cups. |
| Raw vegetable sticks | 1 vegetable cup each | 1.15 to 1.35 raw cups | 3.5 to 5 oz edible per cup | Carrots, cucumber, peppers, celery, snap peas. |
| Leafy salad greens | 2 raw cups equals 1 cup-equivalent | 2.4 to 3.2 raw cups | 2 to 3 oz edible per cup-equivalent | Romaine, spinach, spring mix, kale, arugula. |
| Steamed vegetables | 1 cooked cup each | 1.2 to 1.5 raw cups | 4 to 5.5 oz cooked per cup | Broccoli, green beans, cauliflower, carrots. |
| Roasted vegetables | 1 cooked cup each | 1.4 to 1.8 raw cups | 4.5 to 6 oz cooked per cup | Potatoes, squash, Brussels sprouts, root vegetables. |
| Mixed soup vegetables | 1 cooked cup each | 1.1 to 1.4 raw cups | 4 to 5 oz per cup | Onion, carrot, celery, tomatoes, peas, greens. |
🥕Produce category comparison
Average edible weight for 1 cup sliced fruit; best for lunch boxes and breakfast bowls.
Average edible weight for 1 cup chopped raw vegetables; good for trays and snacks.
Raw leafy greens need double volume to reach one vegetable cup-equivalent.
Plan roughly 1.45 raw cups for each cooked cup after trimming and shrinkage.
📊Common group produce quantities
| Plan size | Moderate goal | Adult target goal | Produce-forward goal | Typical raw buy range |
|---|---|---|---|---|
| 1 person, 5 days | 15 to 18 cup-equivalents | 22.5 cup-equivalents | 27 to 30 cup-equivalents | 8 to 14 lb mixed produce |
| 2 people, 5 days | 30 to 36 cup-equivalents | 45 cup-equivalents | 54 to 60 cup-equivalents | 16 to 28 lb mixed produce |
| 4 people, 7 days | 84 to 100 cup-equivalents | 126 cup-equivalents | 150 to 168 cup-equivalents | 42 to 78 lb mixed produce |
| 8 people, 3 days | 72 to 86 cup-equivalents | 108 cup-equivalents | 130 to 144 cup-equivalents | 36 to 66 lb mixed produce |
| 25 party guests | 25 to 38 cup-equivalents | 50 to 63 cup-equivalents | 75 to 88 cup-equivalents | 14 to 45 lb for trays |
| 50 buffet guests | 50 to 75 cup-equivalents | 100 to 125 cup-equivalents | 150 to 175 cup-equivalents | 28 to 90 lb for trays |
💡Two produce planning tips
When planning meals around produce, you must match the food that you need to eat with the foods that can be bought and stored in your kitchen. Many people struggle with meal planning because they buy too much food or dont buy enough food to last the individuals that they feed. If you do not take into account the amount of food that is waste during the meal preparation process, you could end up with too much food waste or not have enough food to eat.
The calculator use cup measurements to determine the nutritional guidelines for the produce that you buy. Cup measurements, however, will not tell you how much raw produce you need to buy from the store. For example, a cup of chopped melon will not have the same volume as a cup of leafy greens after you cook the leafy greens.
How to Plan and Buy Produce
You must input the number of individuals that will eat the food, the number of days that you would like to plan for meals, and the type of meals that you will prepare to recieve an estimation from the calculator. Yield is another important variable for those that plan meals. The yield will determine how much edible food is harvested from a produce item.
For instance, a pineapple will have a low yield because you will need to remove the skin and the core of the pineapple before eating the produce. Berries, on the other hands, will have a high yield because you will eat the entire berry. If you do not account for the yield, you will not buy enough of the produce item for the number of individuals that will eat the food.
The calculator allows you to choose the number of yield for fruit and vegetables. The amount of food that you cook will change the amount of food that you prepare. For instance, carrots retain their volume when raw versus roasted.
The same can be said for leafy greens. Two handfuls of raw spinach will shrink to a small amount when cooked. The percentage slider for cooked vegetables and leafy greens will allow you to indicate how your household cook its food.
If you cook many roasted vegetables, you will need to purchase more raw vegetables than if you cook many raw salads. Waste in the food preparation process is to be expected. Some food spoilages, food preparation error, and food given to guests will be wasted during the meal preparation process.
It isnt the failure of the cooks in your kitchen, but the expected change in the amount of food prepared. The waste variable in the calculator allows for the amount of food that will not be eaten to be accounted for in the estimation of how much produce to buy. By including the waste factor, you ensure that you buy enough food for the amount of food that will be eaten, as well as for the amount of food that will be lost due to spoilage or extra serving.
The reference tables will help you understand the different relationships of the types of produce that you may purchase. For instance, two cups of loose lettuce will contain the same amount of vegetable as one serving. Therefore, you will have to purchase more of the lettuce to provide the same number of vegetable servings to each individual in your household.
The same can be said of dried fruit and fresh fruit. Understanding the relationships between the produce will help you to understand the specific question that are asked of you when using the calculator. Each household change the types of food that it prepares from week to week.
The calculator allows you to change the mix of food that you eat. By changing the mix of food that the individuals in your household eat, the calculator will change the total weight of the produce that must be bought, as well as the ratio of cooked food to raw food. By running the calculator twice with different assumptions, you can determine the amount of food that you will need for different scenarios in your kitchen.
For instance, you can use the calculator to determine the ideal plan for the kitchen with minimal waste of food. Then, you can use the calculator a second time to provide for the possibility of waste of food due to guests or eat more food than you planned. Finally, when you create your shopping list of the produce that you will need, separate the fragile produce items from the sturdy items.
Fragile produce items like berries will spoil quick. Herbs are also fragile and will last only a few day. Sturdy produce items like apples will last for several days and do not need to be purchased as often as fragile items.
By using the calculator to find the total weight of the produce that you will need, you can determine which items you will purchase immediately for consumption and which can be stored for later in the week.