A1C percent, IFCC mmol/mol, eAG mg/dL, mmol/L, targets, and lab range notes
A1C to Blood Sugar Calculator
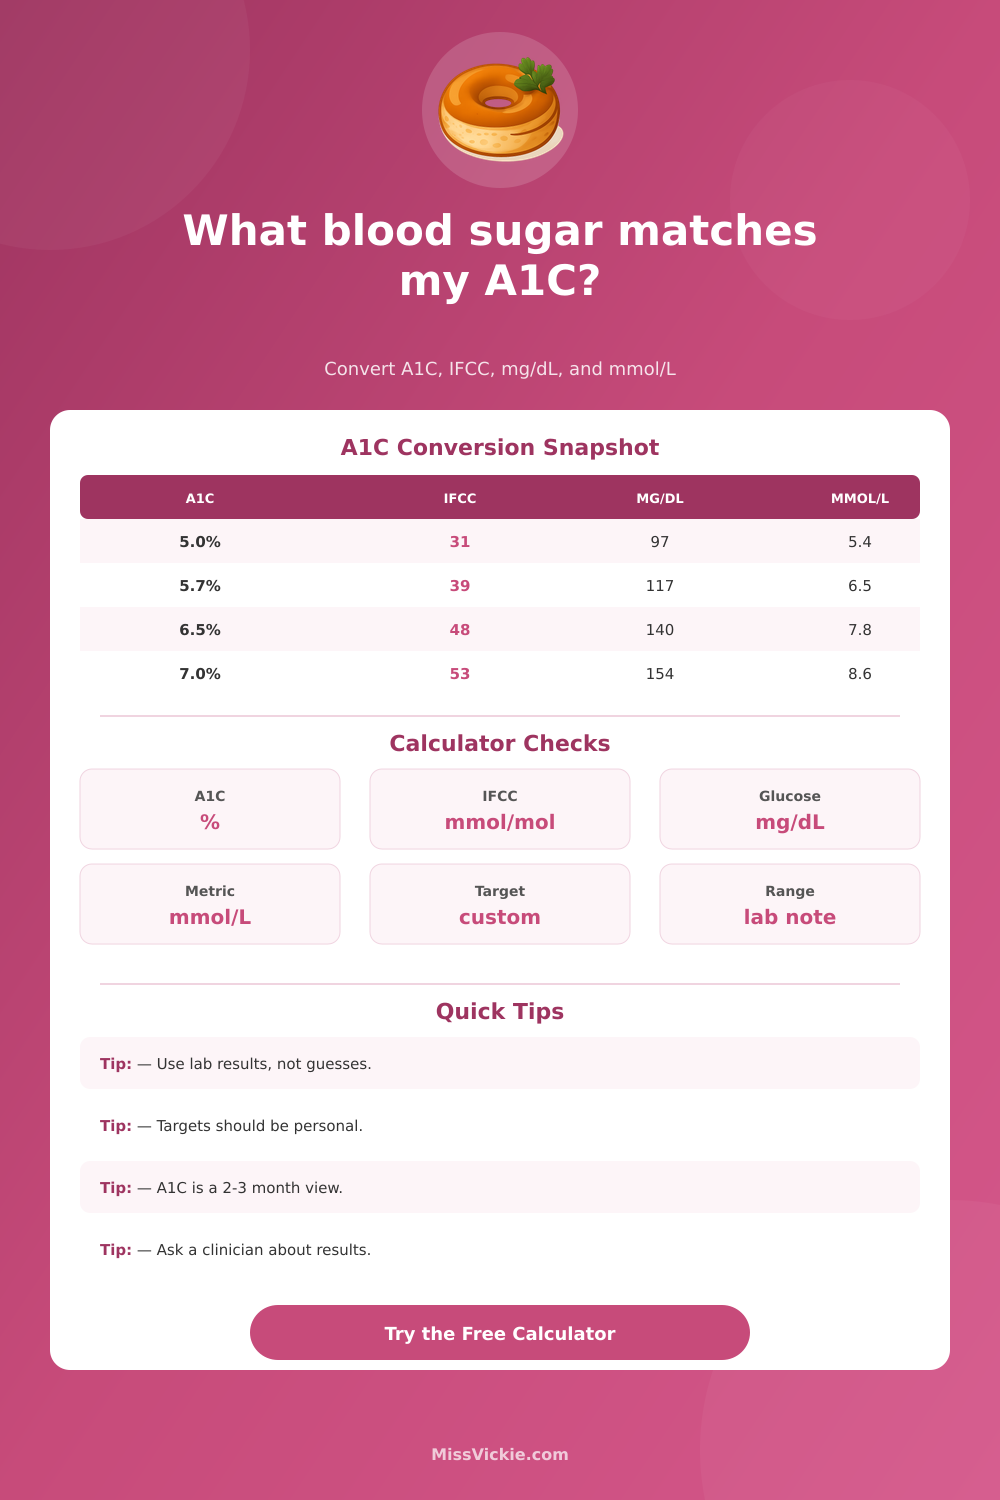
Convert between A1C, estimated average glucose, and IFCC units, then compare the result with common lab ranges and your chosen personal target.
Pick a common lab result or planning scenario, then adjust the units, target, range context, and comparison glucose.
Conversion Breakdown
ADAG relationship from A1C percent to mg/dL.
Approximate glucose conversion to mmol/L.
Converts NGSP percent to mmol/mol.
A1C reflects longer-term glycation, not one meal.
| A1C % | IFCC mmol/mol | eAG mg/dL | eAG mmol/L |
|---|---|---|---|
| 4.5% | 26 | 82 | 4.6 |
| 5.0% | 31 | 97 | 5.4 |
| 5.5% | 37 | 111 | 6.2 |
| 5.7% | 39 | 117 | 6.5 |
| 6.0% | 42 | 126 | 7.0 |
| 6.5% | 48 | 140 | 7.8 |
| 7.0% | 53 | 154 | 8.6 |
| 8.0% | 64 | 183 | 10.2 |
| 9.0% | 75 | 212 | 11.8 |
| Category | A1C % | Approx eAG mg/dL | Note |
|---|---|---|---|
| Below common diabetes threshold | Under 5.7% | Under 117 | Often described as normal range for screening. |
| Prediabetes range | 5.7% to 6.4% | 117 to 137 | Risk range that should be discussed with a clinician. |
| Diabetes diagnostic threshold | 6.5% or higher | 140 or higher | Diagnosis usually requires appropriate lab confirmation. |
| Common treatment goal | Near or below 7.0% | Near 154 | Often cited for many nonpregnant adults, but individualized. |
| Known Value | Reverse Formula | Example | Estimated A1C |
|---|---|---|---|
| eAG mg/dL | (mg/dL + 46.7) / 28.7 | 140 mg/dL | 6.5% |
| eAG mmol/L | ((mmol/L x 18.0182) + 46.7) / 28.7 | 8.6 mmol/L | 7.0% |
| IFCC mmol/mol | 0.09148 x IFCC + 2.152 | 53 mmol/mol | 7.0% |
| A1C percent | 28.7 x A1C - 46.7 | 6.0% | 126 mg/dL |
| mg/dL | mmol/L | Possible Context | Calculator Use |
|---|---|---|---|
| 90 | 5.0 | Lower average glucose | Reverse-estimates A1C near 4.8% |
| 117 | 6.5 | Approx A1C 5.7% | Common prediabetes boundary |
| 140 | 7.8 | Approx A1C 6.5% | Common diabetes threshold |
| 154 | 8.6 | Approx A1C 7.0% | Common individualized goal marker |
An A1C test measure the amount of glucose that has attached to hemoglobin in the blood over a period of two to three month. Since red blood cells resides in the body for approximately two to three months, the A1C test will reflect the average glucose level in the blood over that same timeframe. The A1C test is useful in that it smooths out the glucose levels in the body over the course of a few months, but it can also smooth out significant fluctuation of glucose in the blood.
Thus, the A1C test can reveal acceptable glucose levels for the body over time, even if the glucose levels at certain times of the day are more significantly higher than the average levels. A conversion tool can convert the A1C percentage to an estimated average glucose level in the blood. Furthermore, the tool can also convert the A1C percentage to other units of glucose levels, such as milligrams per deciliter or millimoles per liter.
A1C Test: What It Means and How to Use the Tool
Each of these units indicate the same amount of glucose in the blood, but use different mathematical scale to represent that value. Thus, the tool allow a person to input one value, but will output the other three values automatic. In order to determine whether an A1C result is appropriate for an individual, the user must compare that A1C result to a target glucose level.
The target A1C level for most adult is seven percent, but there are exception to this target for individuals with certain medical condition. A target A1C level can be entered into the tool, along with a range of values around that target, and the tool will indicate whether an individual’s A1C falls within their target range. While this target range can be used to discuss with a clinician as to why that target level has been established for that individual.
Certain medical condition can impact the accuracy of an A1C test result. Conditions like anemia and kidney disease can impact the lifespan of red blood cells in the body. If an individual has anemia, their red blood cells may die at a fasterer rate than those without the condition.
Thus, the A1C test may return a result that is lower than the actual average glucose level in the blood of that patient. Additionally, if an individual has kidney disease, their red blood cells may live longer than those without the condition. Thus, the A1C test may return a result that is higher than the actual average glucose level in the blood of that patient.
These conditions related to the A1C test result can be noted in the tool to remind an individual of the potential inaccuracies of the A1C test. A1C test results provides information that is different than measurements of glucose in the blood in the near future. An A1C test measures the glucose levels over a long period of time, while measurements of glucose in the blood in the near future indicate the glucose levels in the body right now.
These two measurement can help to determine if the glucose levels in the body are experiencing any significant changes or adjustments in their management plan. An A1C result below 5.7% is considered normal, an A1C result between 5.7% and 6.4% is considered prediabetes, and an A1C result of 6.5% or higher indicate diabetes. These threshold allow for an understanding of the glucose levels in the body, but do not indicate the treatment for those levels.
The tables on this page allow individuals to view the relationship between A1C percentages and average glucose level. These tables allow individuals to view the values without perform the calculations of the formulas, and allow for the information to be entered in either direction. For instance, if an individual knows their average glucose level, they can use the table to determine their A1C result.
It is important for an individual to record both A1C and average glucose measurement for the same length of time. If the two measurements do not match, it may be an indication of changes in the glucose level of the body or a medical condition that impact the A1C result.