Food GI, available carbs, portion weight, fiber, protein, fat, acidity, cooking texture, and meal mix
Glycemic Index Calculator
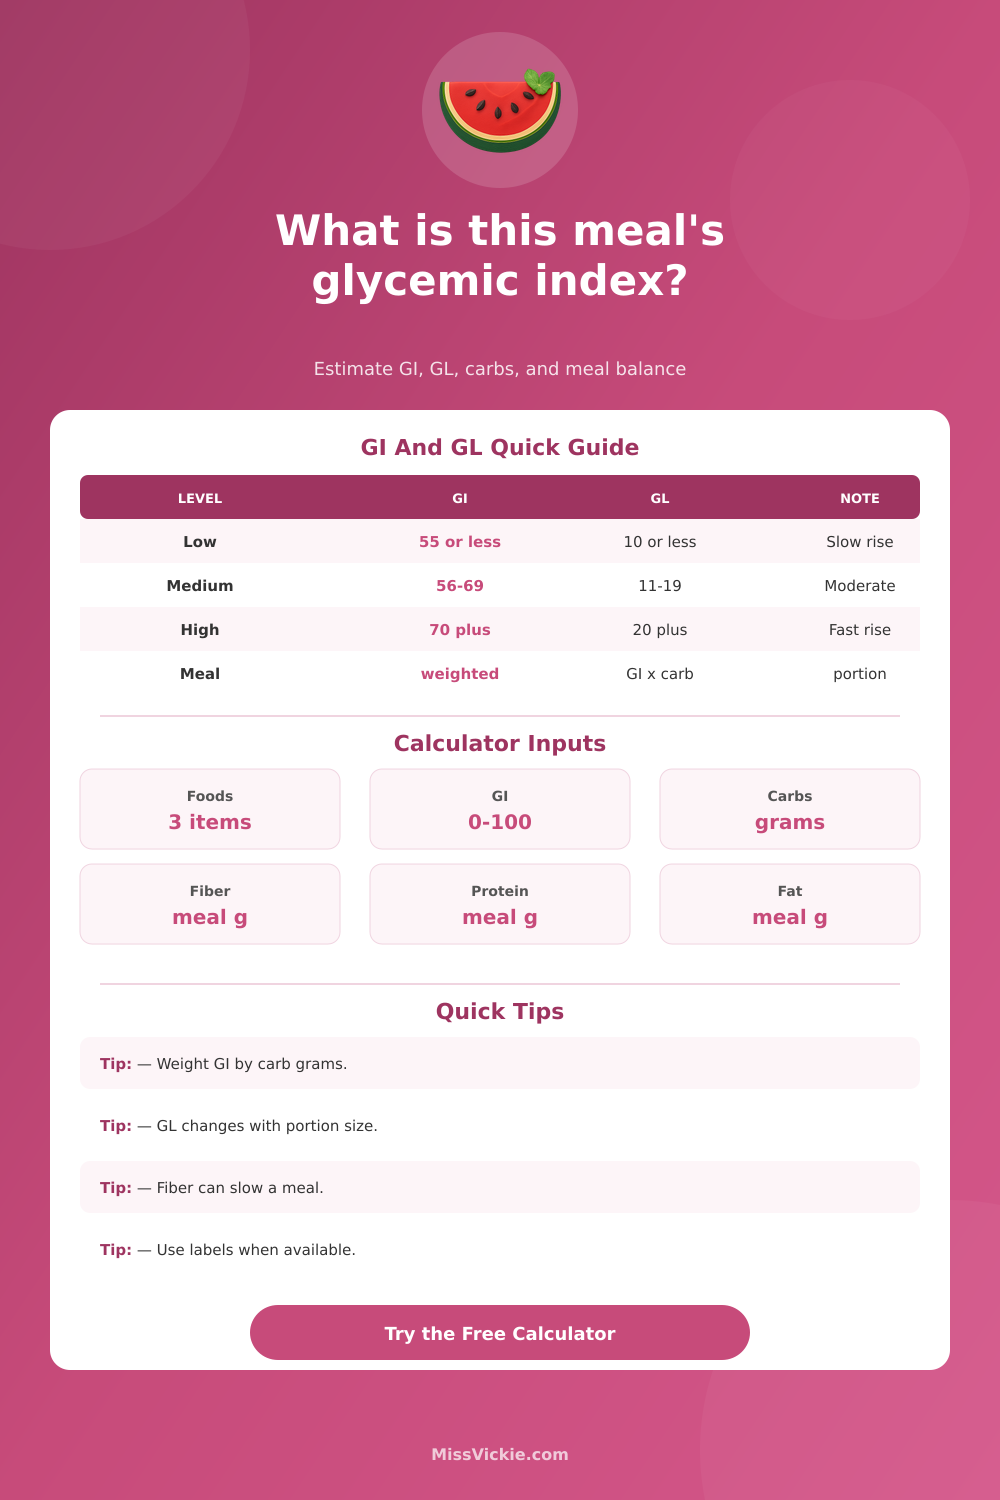
Estimate a mixed meal's carb-weighted glycemic index and glycemic load from up to three foods, then see how fiber, protein, fat, acidity, cooking texture, and food balance may shift the estimate.
Pick a common meal pattern, then edit the foods, GI values, available carb grams, portion weights, and mixed-meal modifiers.
Food Contribution
Calculation Breakdown
Often lower GI because intact starch, fiber, and protein slow digestion.
Structure, cooking texture, and portion size change the meal estimate.
Refined grains can drive the weighted GI when they provide most carbs.
Soft, mashed, instant, or puffed starches commonly estimate higher.
| GI Range | Category | Meaning In This Calculator | Planning Note |
|---|---|---|---|
| 55 or less | Low GI | Estimated slower carbohydrate release compared with glucose | Still check glycemic load because large portions can add up. |
| 56 to 69 | Medium GI | Middle range based on the carb-weighted food mix | Meal modifiers and portion size often matter here. |
| 70 or higher | High GI | Estimated faster carbohydrate release for the carb foods entered | Pairing and portion control can lower the overall meal impact. |
| Mixed meal | Weighted GI | Each food GI is weighted by available carb grams | A tiny high-GI garnish matters less than the main carb source. |
| Food Group | Typical GI Range | Carb Pattern | Meal Use |
|---|---|---|---|
| Beans and lentils | About 25 to 40 | Carbs with fiber and plant protein | Useful for lowering a rice or bread-heavy plate estimate. |
| Rolled oats | About 50 to 55 | Moderate carbs with soluble fiber | Less processed oats usually estimate lower than instant forms. |
| Pasta | About 45 to 55 | Dense starch structure | Al dente texture is generally lower than very soft pasta. |
| Milk or plain yogurt | About 30 to 40 | Lactose plus protein | Sweetened products need label-based carb entries. |
| Food Group | Typical GI Range | What Raises The Estimate | Entry Tip |
|---|---|---|---|
| Basmati or converted rice | About 50 to 60 | Rice type, cooking water, and softness | Use cooked available carbs from labels or nutrition references. |
| White rice | About 70 to 75 | Refined starch and soft texture | It dominates meal GI when it supplies most carb grams. |
| White bread | About 70 to 75 | Fine flour and airy crumb | Count each slice or roll by label carbs. |
| Instant cereal or mashed potato | About 75 to 85 | Puffed, instant, mashed, or very soft starch | Choose the instant texture setting if heavily processed. |
| GL Range | Category | Formula | Why It Matters |
|---|---|---|---|
| 10 or less | Low GL | GI x available carb grams / 100 | A small portion of a higher-GI food can still have a low GL. |
| 11 to 19 | Medium GL | Same formula, larger carb dose | Often where portion size and sides change the result. |
| 20 or higher | High GL | Same formula, high carb load | A low-GI food can become high GL when the carb portion is large. |
| Meal GL | Total meal estimate | Adjusted GI x total available carbs / 100 | Use it beside GI, not instead of the food list. |
| Modifier | Typical Direction | Calculator Handling | Watch Point |
|---|---|---|---|
| Fiber | Lowers estimate | Higher meal fiber subtracts a bounded GI adjustment | Fiber from whole foods is not identical to isolated fiber. |
| Protein and fat | May slow the meal | Moderate amounts lower the adjusted estimate slightly | They do not remove carbohydrate grams from the meal. |
| Acidity | May lower response | Vinegar, citrus, yogurt, or pickled foods add a small reduction | The real effect depends on the full meal and person. |
| Processing and texture | Can raise estimate | Instant, puffed, blended, or mashed starch adds a GI increase | Use this setting for very soft or highly processed starches. |
The glycemic index is a measurement of how fast different carbohydrate foods can raise the blood sugar level of an individual. Researchers created the glycemic index as a research tool for individuals with diabetes, but many individuals use it as a means of maintaining their energy level and avoiding blood sugar spikes after meals. Different carbohydrate foods will raise the blood sugar level of an individual at different speeds, and the glycemic index is the measurement that determines those different speeds.
However, the rate at which different carbohydrates raise the blood sugar level rarely occur in isolation for most meals, as those meals usually contain carbohydrates, fiber, protein, and fat. Thus, the glycemic index calculator includes a means of entering fiber, protein, and fat levels for that meal, as each of these component of meals will impact the blood sugar level that is created by that meal. In order to utilize the glycemic index calculator, an individual must first determine what carbohydrate levels should be entered into the calculator for each food item.
How the glycemic index calculator works
The available carbohydrates are those that will raise the blood sugar level of an individual, so the carbohydrates that should be counted include starches and sugars, but do not include fiber. Only including available carbohydrates rather than total carbohydrates will allow the glycemic load calculation to remain accurately; including total carbohydrates will overstate the glycemic load of foods that contain high levels of fiber, such as beans. Another factor in the glycemic index calculator is the portion weight of the food items that are to be consumed.
As the portion weight of a food changes, the glycemic load of that food will change as well. Thus, the glycemic index calculator allows for each food item to be entered in gram, which allows for more accurate calculations for meals that are eaten from memory or prepared in a restaurant. In addition to the glycemic index of the food items, the glycemic index calculator also includes adjustments for the fiber, protein, and fat content of that meal.
Each of these components will impact the glycemic load of the meal, though they do not impact the number of carbohydrate grams contained in that meal. Each of these components will slow the digestion of the carbohydrates, which will reduce the rise in blood sugar level caused by that meal. Thus, the glycemic index calculator utilizes bounded adjustments for each of these factors, as they each have a real impact on blood sugar levels, but their impact is not unlimited.
In addition to the glycemic index, glycemic load, portion weight, and fiber, protein, and fat content, the glycemic index calculator also utilizes two additional setting for meals: acidity and cooking texture. Each of these can impact the rate at which the carbohydrates in a meal are digested. For instance, foods that contain vinegar, citrus fruit, or yogurt will lead to a slight lowering of blood sugar level after meals, while foods that are soft or instant starches will increase the blood sugar levels after meals.
Thus, these settings allow for more accurate calculations of the glycemic load of meals that are to be prepared. The glycemic index calculator will not produce an accurate reading of an individual’s blood sugar level after meals. The glycemic index calculator produces each of the calculations based off published glycemic index and glycemic load values for foods, as well as the individual’s input for portions and components.
However, the body of an individual may react differently to meals than others, due to factors like activity levels, sleep cycles, medications, and the microbiome of their body. While the glycemic index calculator encourages individuals to focus upon the glycemic load of meals rather than the glycemic index alone, individuals that only focus upon the glycemic index of meals are making a mistake. Foods that have low glycemic index values can still lead to high glycemic loads if the portion size are high.
Thus, the glycemic index and glycemic load values are calculated alongside one another to allow individuals to understand each parameter of each meal. The tables that are published alongside the glycemic index calculator include tables of foods with low, medium, and high glycemic index and glycemic load values. These tables allow individuals to understand the glycemic values of foods without having to memorize the glycemic index and glycemic load values for each food item.
Additionally, the tables group foods with similar glycemic index and glycemic load values together, which allows individuals to quickly create meals without having to research each food item within the meal. Some factors in meals that cannot be measured by the glycemic index calculator include the order of the foods that are to be eaten, the chewing of the food items that are to be eaten, and the temperature of the meals that are to be consumed. Each of these factors can impact the blood sugar levels of individuals, but only insofar as the glycemic index calculator provides an individual baseline against which to evaluate their blood sugar levels.
With the use of the glycemic index calculator over time, individuals will begin to understand what meals will provide the best glycemic load for those individuals. The glycemic index and glycemic load calculations will become a standard upon which individuals create meals, but the calculations will not always be required for the creation of meals. While the glycemic index calculator may provide an individual with a means of understanding how meals can impact the blood sugar levels of the body, the glycemic index calculator does not provide a complete understanding of these impacts.
Thus, while the glycemic index calculator provides the baseline information that is required to understand the potential impact of meals upon blood sugar levels, personal observation of those blood sugar levels can provide the remaining information regarding the impact of meals upon an individual’s health.