Calories, protein, fiber, micronutrients, sodium, and sugar
Nutrient Density Calculator
Score a food or meal by what it gives you per calorie, then see how protein, fiber, vitamins, minerals, sodium, added sugar, serving size, and food group shift the result.
Choose a common food profile, then edit the serving and nutrition label values for the exact item you are comparing.
Score Breakdown
Usually very high micronutrients with few calories.
Protein, fiber, iron, folate, and steady energy.
Protein, B12, selenium, iodine, and omega-3 fats.
Better when fiber and minerals are preserved.
Vitamin C, potassium, water, and natural sweetness.
Protein, calcium, iodine, and B vitamins when unsweetened.
Mineral dense, but calorie dense by small servings.
Score depends heavily on sodium, sugar, and fiber.
| Score Band | Typical Meaning | Food Examples | How To Use It |
|---|---|---|---|
| 85 to 100 | Very high nutrient density | Leafy greens, shellfish, legumes with low sodium | Great anchor or frequent side |
| 70 to 84 | Strong everyday choice | Fish, Greek yogurt, beans, broccoli, oats | Build meals around it |
| 55 to 69 | Moderate density | Whole grains, eggs, fruit, mixed recipes | Pair with vegetables or protein |
| 35 to 54 | Lower density or calorie dense | Nuts, refined grains, sweetened dairy | Portion carefully |
| 0 to 34 | Low density or high limit nutrients | Sweet drinks, salty snacks, many instant meals | Use occasionally or improve recipe |
| Food Group | Model Multiplier | Why It Changes The Score | Common Watch Point |
|---|---|---|---|
| Vegetable or leafy green | 1.08 | Rewards low-calorie vitamin and mineral density | Added sauces can add sodium |
| Beans, peas, or lentils | 1.05 | Balances protein, fiber, folate, iron, and potassium | Canned versions can be salty |
| Seafood, meat, eggs, or tofu | 1.00 | Protein counts strongly without forcing all foods into one pattern | Sat fat and sodium vary by item |
| Dairy or fortified alternative | 1.00 | Protein, calcium, iodine, and B vitamins can be meaningful | Sweetened versions lose points |
| Whole grain or starchy food | 0.96 | Useful energy foods score best when fiber is high | Refined grains have fewer credits |
| Nuts, seeds, or avocado | 0.92 | Micronutrient rich but calorie dense in small portions | Serving size changes the result fast |
| Packaged or ultra-processed item | 0.84 | Discounts items likely to rely on fortification and additives | Sodium and added sugar penalties |
| Nutrient Factor | Best Range Per 100 Calories | Score Effect | Practical Label Check |
|---|---|---|---|
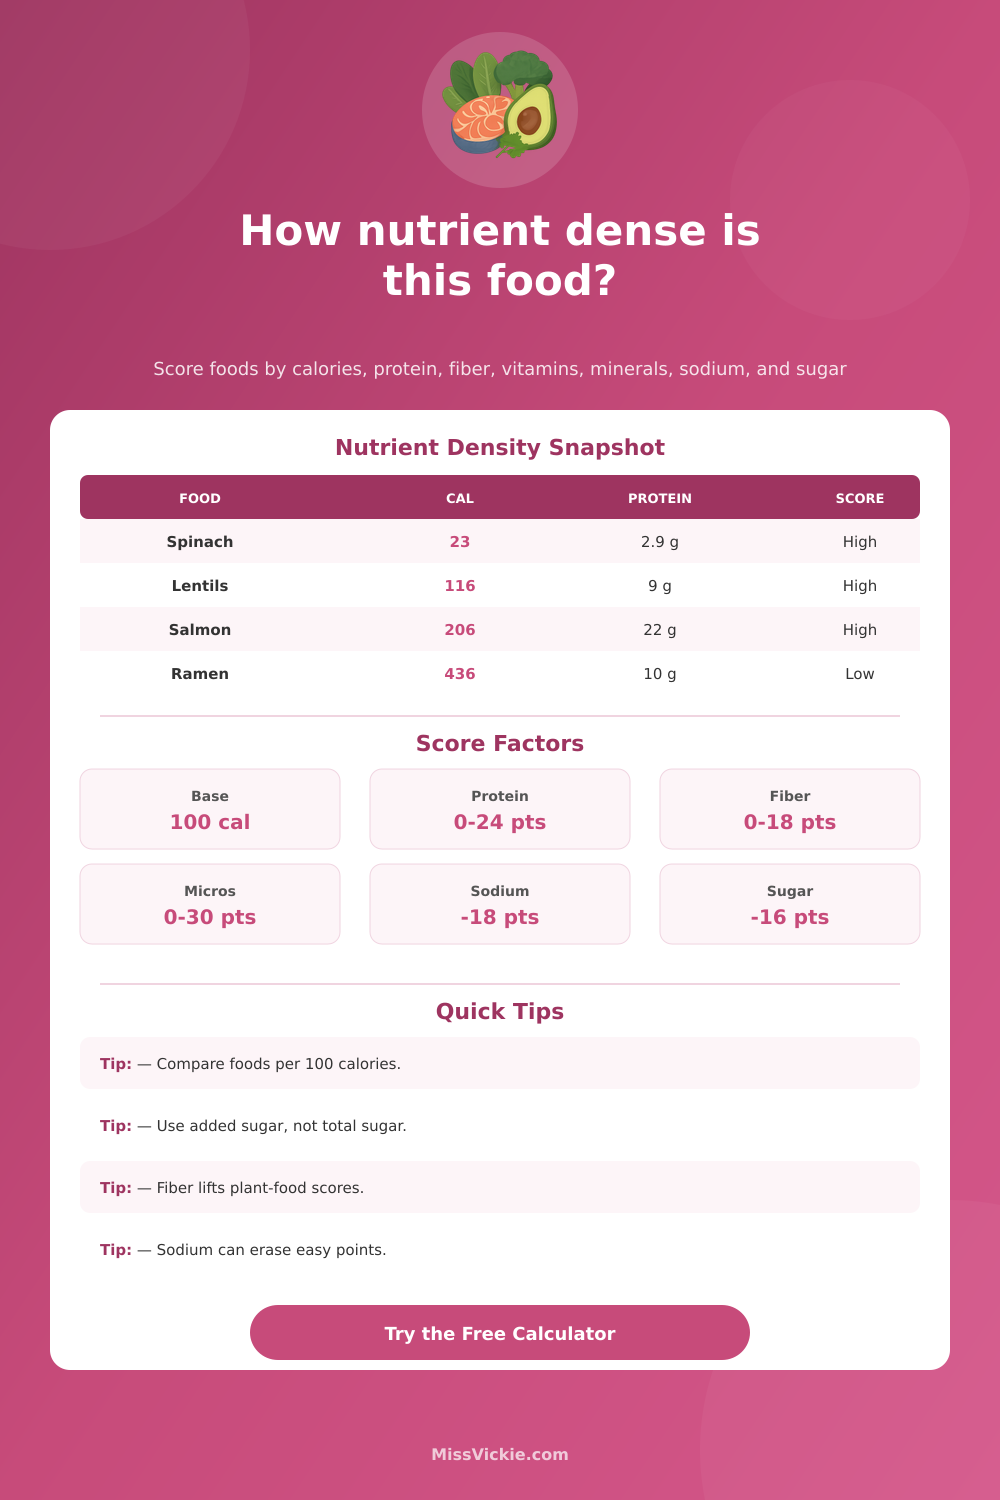
| Protein | 8 g or more | Up to 24 credit points | High for meats, seafood, tofu, yogurt, legumes |
| Fiber | 5 g or more | Up to 18 credit points | High for beans, vegetables, berries, oats |
| Vitamins and minerals | 80% DV total or more | Up to 30 credit points | Add meaningful listed daily value percentages |
| Sodium | Under 230 mg | Penalty rises above target | Compare salty foods per 100 calories |
| Added sugar | Under 3 g | Penalty rises above target | Use added sugar when the label provides it |
| Saturated fat | Under 2 g | Small penalty above target | Most important in high-calorie servings |
| Preset Food | Serving Used | Calories | Why The Score Lands There |
|---|---|---|---|
| Cooked spinach | 180 g | 41 | Very high micronutrient score with strong fiber per calorie |
| Lentils bowl | 198 g | 230 | Protein and fiber both contribute meaningful points |
| Baked salmon | 170 g | 350 | Protein and micronutrients are high with little sugar |
| Plain Greek yogurt | 170 g | 100 | Protein dense, especially when unsweetened |
| Instant ramen | 1 package | 436 | Sodium penalty offsets calories and modest protein |
Nutrient density is a measurement of the amount of nutrition that a food product contain relative to the amount of calories that the food contains. While many individual may choose food products based upon habit or cost, nutrient density allow for individuals to choose foods based upon their nutritional value. The calculator allows individuals to input facts about the nutritional value of the food that they are consuming into the calculator, which then translates the nutritional value of that food into a basis of 100 calories.
Using 100 calories as a basis for the measurement of nutrient density allows for foods of different serving size to be compared to one another. For instance, it is impossible to directly compare the nutritional value of a small portion of almonds to a large portion of spinach unless each food is translated into a 100-calorie basis; otherwise, the comparison isnt accurate. Nutrient density scores increase for foods that contains protein, fiber, vitamins, and minerals.
What Nutrient Density Means and How to Use the Calculator
Protein increases the nutrient density score of a food because protein is a nutrient component that is often lacking in meals. However, the score can only increase to a certain limit with increased protein content, since too much protein in meals is not necessarily beneficial to the individual. Fiber increases the nutrient density score for the same reasons that protein do; fiber is a component of meals that is often lacking in the diet of many individuals.
However, the increase in nutrient density that fiber provides is more less than that provided by protein, since few foods are high in fiber content. Finally, the micronutrient component of the nutrient density score increase as a result of the vitamin and mineral content of the food being measured; the scores of those nutrients are summed to calculate the total micronutrient value of the food. Nutrient density scores decrease for foods that contain high level of sodium, added sugar, or saturated fat.
These three nutrients is referred to as the “limit nutrients,” and each of them is deducted from the nutrient density score of a food product. For instance, a food product that is high in protein but also high in sodium will score lower in nutrient density calculations than a food that has the same amount of protein but less sodium content. Additionally, foods that may appear healthy may score low in nutrient density calculations if the food contain high levels of added sugar.
The food group and the level of processing of the food also impact the nutrient density calculations. For instance, foods that are classified as vegetable or legumes tend to receive higher nutrient density scores due to the fact that these foods contain many micronutrients but relatively few calories. Foods that is ultra-processed receive lower scores due to the fact that the nutrition content of ultra-processed foods often comes from added fortification rather than from the food product itself.
While this does not mean that individuals should avoid eating ultra-processed foods, it does mean that whole foods will score higher in nutrient density calculations than ultra-processed foods. The nutrient density score return as a single number between zero and one hundred. Foods that score above eighty-five have high nutrient density value, indicating that they are a good choice for meals and do not require much balancing of nutrients.
Foods with scores in the seventies are considered to be a reliable choice for meals. Foods with scores in the seventies may be eaten as part of a meal, but should be paired with other food group. Foods in the middle range of scores are fine to eat as part of a meal, but rarely stand alone as the complete meal for an individual.
Foods with low nutrient density scores contain a high number of calories relative to the nutrients that the food contains, or have high levels of sodium or added sugar. While foods with high levels of protein will score high on nutrient density calculations, this is not always the case. For instance, a protein bar will contain approximately fifteen grams of protein, but may score in the middle range of nutrient density if it also contains added sugar and sodium.
However, foods like a can of beans may have less protein, but will score highly on nutrient density calculations because of the fiber content within the food. When using the nutrient density calculator, it is important to distinguish between total sugar and added sugar. Added sugar is the ingredient that is requested of the user because sugars found in whole fruits or dairy products also contain fiber, water, and micronutrient.
If total sugar was utilized instead of added sugar, produce foods with high levels of natural sugar would score lower on nutrient density calculations. For instance, plain yogurt and sweetened yogurt have the same base ingredient, but the nutrient density score will be different for each product due to the added sugar content within the sweetened yogurt. The portion goal allow for the user to input the portion size of the food that is to be evaluated.
Portions for snacks are different from portions for meals, and this adjustment ensure that foods with high calorie counts will score highly on nutrient density calculations. For instance, large portion of almonds will score highly because they are high in both nutrient and calories. Additionally, items with low calorie counts will score highly as well, such as side for a meal.
The nutrient density calculator does not account for all variable for food and nutrients. For instance, cooking method will impact the sodium content of the food. A home cooked meal will score higher than a restaurant meal because the home cooked meal will have less sodium.
Additionally, individual budget will impact the food that an individual may be able to purchase; they may score highly with a low nutrient density food than with an excellent food that they cannot afford. One of the uses of the nutrient density calculator is to compare different version of the same food. For instance, the plain version of a food can be compared with a seasoned or sweetened version of the same food.
Additionally, the whole food can be compared with the packaged food product. For instance, a whole food product like tomatoes can be compared with the tomato sauce product that may be used to replace the tomato. Using these comparison, individuals can learn about the difference in nutrient density scores for each food.
These differences is caused by factor like sodium content, added sugar content, and the level of refinement in the product. By learning about these difference, individuals can use these rule as a means of making decision each day about what foods they will eat.